Bode Plot Generator
This app will generate the Bode Plot given a transfer function of the form (a + bs) e-ts / (g + hs).
Download
Bode.xlsxHow to use
Key in the values of a, b, g, h and t into the sheet, along with the frequency range for the plot.
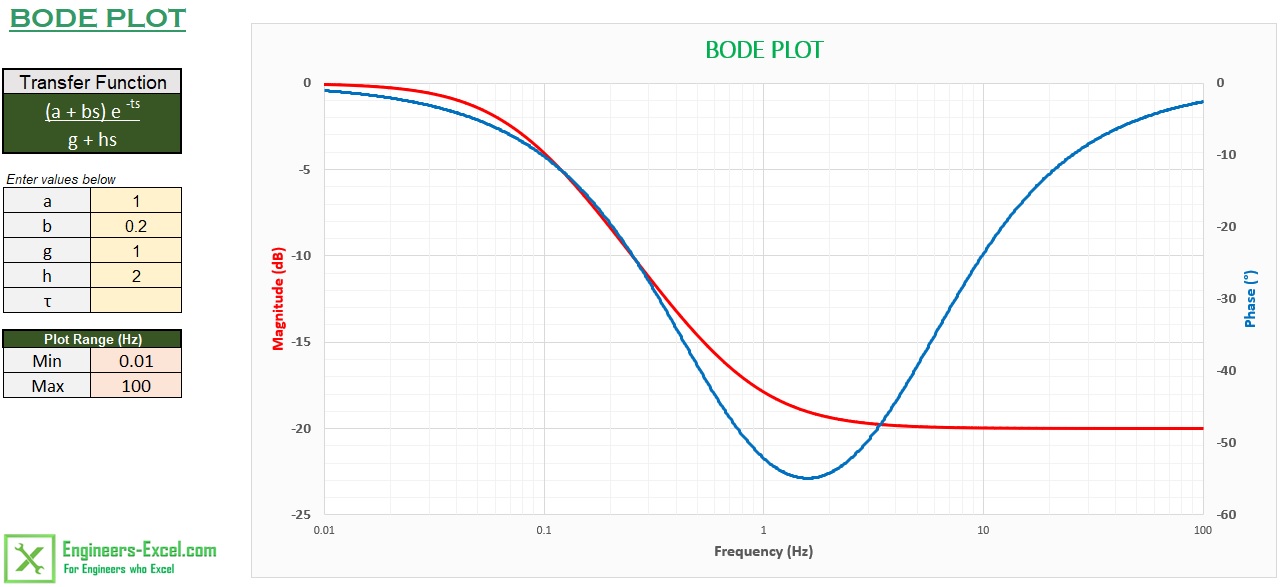
The figure above shows the Bode plot of (1 + 0.2s)/(1 + 2s), from 0.01 Hz to 100 Hz. The entries are
a = 1,
b = 0.2,
g =1,
h = 2 and
t = 0.
I would like to thank Dung Huynh for suggesting changing the plot to show amplitude in decibels and frequency in Hertz. Dung also helped test and improve this version of the tool. The previous version of the tool showed Amplitude as a ratio and frequency in radians/second
How it works
The amplitude and phase are calculated at 1000 points over the frequency range using defined names and formulae. All formulae are evaluated in the memory, there are no calculations done directly on the spreadsheet.
Note that the division of the frequency is done on a logarithmic scale. The formula for the frequency is:
w=10^(LOG(Sheet1!$B$13)+(ROW(OFFSET(Sheet1!
$A$1,0,0,1001,1))-1)*(LOG(Sheet1!$B$14)-LOG(Sheet1!$B$13))/1000)
The ROW and OFFSET formulae are used to generate the array of numbers 1 to 1000, which is then used to get 1000 points between the specified range. See page 531 of the sample chapter 15 from Stephen Bullen's book Professional Excel Development for a detailed description of this technique.
The amplitude calculation is quite straightforward, the formula is
Amplitude = SQRT((a^2+(b*w)^2)/(g^2+(h*w)^2)),
which is the ratio of the magnitude of the numerator divided by the magnitude of the denominator.
The calculation for the phase angle is not so straightforward:
Phase = IF(ATAN2(a,b*w)<0,360+DEGREES(ATAN2(a,b*w)),DEGREES(ATAN2(a,b*w)))-IF(ATAN2(g,h*w)<0, 360+DEGREES(ATAN2(g,h*w)),DEGREES(ATAN2(g,h*w)))+DEGREES(-t*w)
In simple words, the formula is: Phase = (Phase of Numerator) - (Phase of denominator) + (Phase from the exp term).
The calculation uses the ATAN2 formula, which gives the inverse tangent of the specified x- and y-coordinates between -PI and PI. Since this range is not applicable for the Bode plot, it is modified using the IF statement. The angles are converted to degrees using the DEGREES formula.