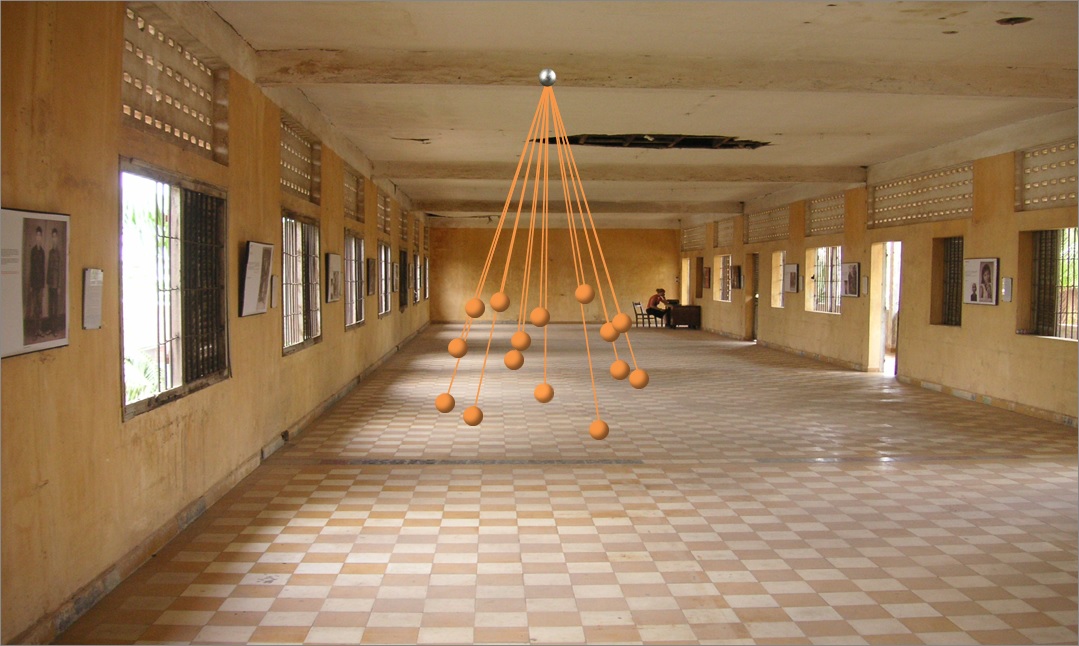
Simulation of Pendulum Waves
Pendulum Waves are created using a set of pendulums of varying lenghts to produce a beautiful visual effect.

The video below shows a real life example.
The pendulums wave effect can be created using Excel formulae and charts as shown in the video below.
Download
Pendulums xlsmNotes
The mathematics behind the calculation of the end points of the pendulums is discussed in this blog post.A simple macro increments a counter hidden behind the "Run" button to increment the time values that in turn updates the calculations on the sheet, which in turn updates the chart.
.